2021 Data Sources
The data sources for facts and figures featured in the 2021 Goalkeepers Report are listed here by section. Brief methodological notes are included for unpublished analyses.
Innovation and Inequity
See last year’s initial projections of the impacts of the pandemic on the Sustainable Development Goals in the 2020 Goalkeepers Report, COVID-19: A Global Perspective.
The Data Tells a Surprising Story
Millions more in extreme poverty
World Bank Group. Global Economic Prospects. June 2021. https://openknowledge.worldbank.org/bitstream/handle/10986/35647/9781464816659.pdf
International Monetary Fund. World Economic Outlook Database, April 2021. Accessed August 2021. https://www.imf.org/en/Publications/WEO/weo-database/2021/April
Ratio of COVID-19 deaths by sex from IHME analysis, 2021. Controlling for the agedistribution of the global population, the ratio of male:female deaths is 1.72. IHME’s latest COVID-19 projections can be accessed at https://covid19.healthdata.org and related publications at https://healthdata.org/covid/publications.
International Labour Organization. Building Forward Fairer: Women’s rights to work and at work at the core of the COVID-19 recovery. July 2021. https://www.ilo.org/wcmsp5/groups/public/---dgreports/---gender/documents/publication/wcms_814499.pdf
For more information about poverty estimates by the Institute for Health Metrics and Evaluation (IHME), see the Explore the Data section in this report.
Growing Gaps in Education
Learning poverty is defined as being unable to read and understand a simple text by age 10.
World Bank Group. Ending Learning Poverty: What Will It Take? Washington, DC: World Bank Group, 2019. https://openknowledge.worldbank.org/handle/10986/32553
World Bank Group. Realizing the Future of Learning; From Learning Poverty to Learning for Everyone, Everywhere. December 2020. World Bank, Washington, DC. https://documents1.worldbank.org/curated/en/250981606928190510/pdf/Realizing-the-Future-of-Learning-From-Learning-Poverty-to-Learning-for-Everyone-Everywhere.pdf
Lewis, Karyn, Megan Kuhfeld, Erik Ruzek, and Andrew McEachin. Learning during COVID-19: Reading and math achievement in the 2020-21 school year. NWEA research brief. Center for School and Student Progress. July 2021. https://www.nwea.org/content/uploads/2021/07/Learning-during-COVID-19-Reading-and-math-achievement-in-the-2020-2021-school-year.research-brief-1.pdf
More Children Missing Vaccines
For more information about vaccine coverage estimates by the Institute for Health Metrics and Evaluation (IHME), see the Explore the Data section in this report.
People Stepping Up
World Health Organization. World Malaria Report 2020: 20 years of global progress and challenges. Geneva: World Health Organization, 2020. https://apps.who.int/iris/rest/bitstreams/1321872/retrieve
World Health Organization. The potential impact of health service disruptions on the burden of malaria. A modelling analysis for countries in sub-Saharan Africa. Geneva: World Health Organization, April 23, 2020. https://www.who.int/publications/i/item/9789240004641
Sherrard-Smith, et al. “The potential public health consequences of COVID-19 on malaria in Africa,” Nature Medicine 26 (September 2020): 1411–1416. https://www.nature.com/articles/s41591-020-1025-y.pdf
Investing in Systems
Our World in Data compiles and publishes updated information on vaccine doses administered by geography: https://ourworldindata.org/covid-vaccinations (accessed August 2021).
The COVID-19 Vaccine Market Dashboard tracks information on the world’s COVID-19 vaccine market, including vaccine agreements, doses secured, and deliveries by country. Accessed August 2021. https://www.unicef.org/supply/covid-19-vaccine-market-dashboard
Investing in Communities
Sarr, Moussa. “How Did Senegal Mitigate the Impact of COVID-19 on Routine Childhood Immunizations?” Exemplars in Global Health – Perspectives (blog). Accessed August 2021. https://www.exemplars.health/emerging-topics/epidemic-preparedness-and-response/covid-19/appendix/perspectives/thread?forumId=9&threadId=43
Dixit, Sameer M. et al. “Addressing disruptions in childhood routine immunization services during the COVID-19 pandemic: perspectives and lessons learning from Liberia, Nepal and Senegal,” medRxiv March 18, 2021. Preprint. https://doi.org/10.1101/2021.03.18.21252686
Investing in Women and Girls
The Ehsaas Emergency Cash program in Pakistan has a public dashboard that tracks total beneficiaries served and total amounts disbursed. Accessed August 2021. https://www.pass.gov.pk/ecs/uct_all.html
Additional gender analysis was conducted by Elizabeth Katz, Safa Abdalla, and Judy Rein with research assistance from Katelyn Roett and Lauren Lamson at the Global Center for Gender Equality at Stanford University.
Even Further, Even Faster
New Sources of Innovation
Africa Vaccine Manufacturing Initiative. Vaccine Manufacturing and Procurement in Africa. Study. 2017. https://www.avmi-africa.org/wp-content/uploads/2017/09/VMPA-Study-e-book.pdf
Africa Centres for Disease Control and Prevention. Africa’s Vaccine Manufacturing for Health Security. Discussion paper. Presented at the Conference on Expanding African’s Vaccine Manufacturing, April 2021.
Explore the Data
A Malaria-Free China Paying It Forward
Ding, Cheng, Chenyang Huang, Yuqing Zhou, Xiaofang Fu, Xiaoxiao Liu, Jie Wu, Min Deng, Lanjuan Li, Shigui Yang. “Malaria in China: a longitudinal population-based surveillance study.” Epidemiology and Infection 148, E37 (2020): 1–8. https://doi.org/10.1017/S0950268820000333
World Health Organization. Malaria incidence estimates for 2017–2020 from “Global Health Observatory data repository.” WHO (website). Accessed August 2021. https://apps.who.int/gho/data/view.main.MALARIAINCIDENCEv?lang=en
Explore the Indicator Pages
The first part of this 2021 Data Sources section provides a general description of the methodology used by IHME to estimate the effects of the COVID-19 pandemic on the 14 Sustainable Development Goal (SDG) indicators and their accompanying projections to 2030. The general description is followed by methodological notes and sources specific to each of the 14 indicators modeled by IHME and concludes with sources and notes for the remaining four indicators estimated through other sources.
IHME General Methodology
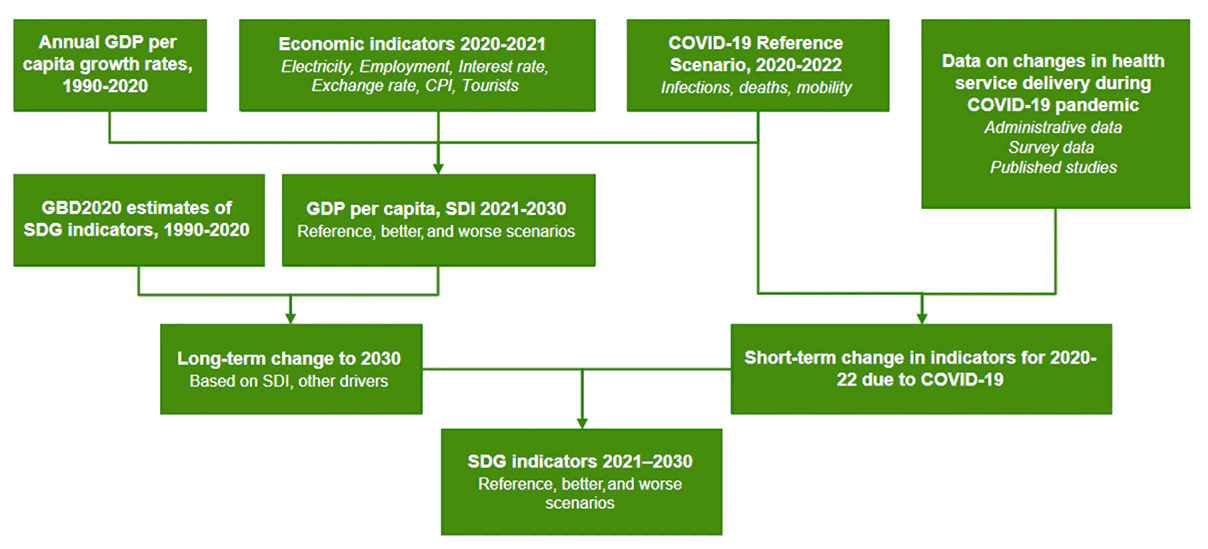
To estimate the effects of the COVID-19 pandemic on the SDG indicators included in the Goalkeepers Report and their accompanying projections to 2030, IHME implemented an approach as shown in Figure 1 for capturing both the short-term effects of the COVID-19 pandemic as well as the long-term effects that reflect its impact on economic production and development and the consequences of these on the SDG indicators.
COVID-19 Projections of Infections, Deaths, and Mobility
These projections are based on a hybrid Susceptible-Exposed-Infected-Recovered or SEIR model, in which the model analyzes data on cases, hospitalizations, deaths, and seroprevalence studies to estimate past infections. The SEIR model then fits a statistical model of transmission to the past infections using a range of drivers, including cellphone mobility (predicted by mandates and the underlying trend), mask use, and seasonal patterns in the pneumonia death rate. It also takes into account immune escape variants such as the delta variant, as well as the scale-up of COVID-19 vaccines by type, including their effect on ancestral and escape variants.
For the purposes of this report, projections were extended to December 31, 2022. To project the most likely or reference scenario for this time period, the projections incorporate re-imposition of social distancing mandates on a location-specific basis for six weeks when the daily death rate for that location reaches eight deaths per million population. This threshold corresponds to the 90th percentile of the threshold for mandates in the first round, and the median for the second round of mandates. This reflects the increased reluctance of decision makers to impose mandates due to the economic consequences. Re-imposition of mandates reduces projected mobility based on the historical, location-specific reduction in mobility, which in turn reduces transmission in the SEIR model and subsequently infections and deaths from COVID-19.
Effect of the COVID-19 Pandemic on Health Indicators as Mediated by Income and Development
To capture the impact of COVID-19 and the subsequent global economic recession on key indicators, IHME modeled the current and projected effects of the pandemic on GDP per capita to 2030. To estimate the impact of COVID-19 and COVID-19 policy responses on economic production (i.e., GDP per capita) in the short term (2020, 2021, and 2022), IHME developed a three-step process.
First, estimates of GDP per capita for 2020 were extracted from the World Bank. These estimates were combined with GDP estimates from four other sources, and GDP per capita was estimated from 1950 through 2020 using methods described in the references cited below. These estimates show a 3.8% drop in global GDP per capita in 2020.
Second, IHME assessed the relationship between estimated COVID-19 deaths, mask use, vaccination rates, and changes in population mobility (as described in the previous subsection) against key GDP correlates, each measured monthly through June 2021. Numerous GDP correlates were considered. For the final analysis, IHME relied on five key GDP correlates: tourist arrivals, consumer price index, electricity production, employment rates, and short-term interest rates. Sources include the CEIC Global Database, International Monetary Fund, Organisation for Economic Co-operation and Development, World Bank, and World Bank World Development Indicators. Using the estimated relationship between these five GDP correlates; past COVID-19 deaths and mobility; and projected COVID-19 deaths, mask use, vaccination rates, and mobility patterns from IHME, IHME was able to estimate expected relative changes for these five correlates through the end of 2022.
Third, IHME assessed the historical relationship between changes in these same five correlates and GDP growth rates, using annual data from 2005 through 2020. Using this relationship along with projected 2021 and 2022 growth rates for the correlates, IHME estimated COVID-19-sensitive GDP growth rates for 2021 and 2022. For estimating annual economic growth beyond 2022 and developing alternative scenarios, IHME used its existing IHME GDP forecasting framework, described in the references below.
The projected drop in GDP growth in 2020–2022 leads to slower growth rates from 2023 onward and indirectly includes long-term effects of the recession on economic development.
IHME reflected revised GDP projections in its projections of the Socio-demographic Index (SDI), which incorporates income, fertility, and education. Using the existing framework, IHME also estimated the downstream consequences of reduced GDP on health spending and development assistance of health. Key drivers were identified for each indicator and were in turn used for the projections to 2030. This approach allows for the forecasted economic COVID-19 impacts on GDP to be reflected in the SDG indicator projections to 2030.
The “better” and “worse” scenarios were constructed from SDI and other key drivers identified for each indicator, using the 85th and 15th percentile of past rates of progress. For some indicators, scenarios from these drivers were combined with the 85th and 15th percentile of the country-specific slopes in the second stage of the modeling process.
World Bank. Global Economic Prospects, June 2021. Washington, DC: World Bank, 2021. License: Creative Commons Attribution CC BY 3.0 IGO. https://doi:10.1596/978-1-4648-1665-9
James, Spencer L., Paul Gubbins, Christopher J. L. Murray, and Emmanuela Gakidou. “Developing a comprehensive time series of GDP per capita for 210 countries from 1950 to 2015.” Population Health Metrics 10, no. 12 (July 30, 2012): https://doi.org/10.1186/1478-7954-10-12
Global Burden of Disease Health Financing Collaborator Network. “Health sector spending and spending on HIV/AIDS, tuberculosis, and malaria, and development assistance for health: progress towards Sustainable Development Goal 3.” Lancet 396, no. 10252 (September 5, 2020): 693–724. https://doi.org/10.1016/S0140-6736(20)30608-5
Effect of the COVID-19 Pandemic on Health Indicators in 2020-2022
Health services have also potentially been disrupted due to the implementation of social distancing mandates or lockdowns. IHME relied on multiple data sources to estimate this effect of the pandemic on health indicators. One critical source was smartphone-based surveys conducted during 2020 and 2021 for the following target populations:
- General population: Main indicators include health care utilization and missed medication doses. Respondents to the 2020 survey were invited to respond to a new survey in 2021.
- General population in malaria-endemic countries: Main indicators include receipt of insecticide-treated bed nets (ITN) and use of artemisinin-based combination therapy (ACT) among respondents reporting a positive malaria test. Respondents to the 2020 survey were invited to respond to a new survey in 2021.
- Women of reproductive age: Main indicators are use of contraceptives and interruption in access to contraceptives. Respondents to the 2020 survey were invited to respond to a new survey in 2021.
- Pregnant women or women who have given birth in the last six months: Main indicators include number of antenatal care visits, in-facility delivery, and presence of a skilled birth attendant. A new sample of eligible participants was recruited in 2021.
- Caregivers of children under the age of 2 years: The main indicator is vaccine coverage. A new sample of eligible participants was recruited in 2021.
- Caregivers of school-age children: This survey was conducted only in 2021.
Survey weights were created for the data according to the age, sex, and educational attainment profiles by country to improve the quality of the final estimates. The survey data was used to estimate the change in the key indicators or underlying drivers among three time periods: the pre-pandemic period (December 2019–February 2020), during the early months of the pandemic (March 2020–June 2020), and later in the pandemic (February 2021–May 2021).
More information about the smartphone-based surveys and access to the survey data can be found at http://ghdx.healthdata.org/series/covid-19-health-services-disruption-survey.
In addition to the survey data collection noted above, IHME also analyzed survey data from:
- The University of Maryland Social Data Science Center Global COVID-19 Trends and Impact Survey (UMD Global CTIS), in partnership with Facebook, which asks respondents about missed health service utilization (services, products, treatment, and medicine) over the past 30 days.
- World Bank high-frequency phone surveys.
- United States Census experimental Household Pulse surveys.
- Performance Monitoring for Action (PMA) surveys that incorporate a telephone-based follow-up of respondents from surveys prior to the pandemic (Kenya, Burkina Faso, Nigeria, Democratic Republic of the Congo).
Each of the sources had used different questions, recall periods, and study populations to investigate missed health care visits. Great care was taken to align the variables for maximum comparability.
Finally, IHME also analyzed available administrative data for the pandemic period, including monthly vaccine doses for DTP3 and MCV1 reported to WHO, ART doses reported to UNAIDS, inpatient utilization data for selected countries, and mortality data by cause for selected countries. Additional sources of vaccine administrative data for 2020 were also analyzed from the following sources: Asociación Española de Vacunología; DHIS2 in Nepal; India Health Management Information System Standard Report; National Centre for Immunisation Research and Surveillance in Australia; Nigeria National Health Management Information System; Public Health England; and Public Health Scotland.
IHME related the level of health service interruption (e.g., relative ratio of vaccine doses delivered or health visits) to measures of cellphone mobility developed as part of the COVID-19 projections. These mobility estimates are based on data from Facebook, Google, Descartes Labs, and SafeGraph; this data has been shown to be highly related to the imposition of social distancing mandates by governments. To estimate the relationship between health service interruption and mobility, IHME used a two-step random-spline meta-regression. The first step captures the nonlinear relationship between the level of interruption and mobility changes, and it allows for variation in this relationship by country. The second step analyzes the residuals over time to capture temporal changes in the relationship by country (e.g., resumption of routine immunization services and targeted catch-up of children who missed doses). This function is then combined with the projections of mobility to December 31, 2021, to estimate changes in indicators or drivers for 2020 and 2021. These are then used to adjust the long-term projections as described earlier in this section.
Limitations
Given reporting lags, there was limited data, particularly from administrative data sources for both economic and specific health indicators. Although IHME collected important survey data, a segment of the population cannot be reached through smartphone data collection, and thus is not represented in the sample. The precision of several indicator estimates is limited by small subsample sizes.
IHME was not able to incorporate debt explicitly into its economic analysis. However, the long-term effects of debt due to COVID-19 are captured indirectly through slower economic growth rates.
There is also considerable uncertainty in the COVID-19 projections, particularly as they relate to the probability of new variants emerging.
Indicators Estimated by IHME
Poverty
The extreme poverty rate measures the fraction of a country’s population that is estimated to live on less than US$1.90 per day, measured in 2011 purchasing power parity (PPP) adjusted dollars. To estimate a complete time series of extreme poverty for all countries, all available data was first extracted from the World Bank and supplemented with data extracted from the United Nations’ World Institute for Development Economics Research and country-specific surveys. Second, IHME modeled this extracted data using an approach that builds from available data and borrows strength across time, geography, and predictive covariates (GDP per capita, female education, kilocalorie consumption, natural resource exports, and government expenditure).
IHME models the mean consumption rate for each country and year and the consumption distribution (the Lorenz curve) for each country in order to estimate the value of consumption for each percentile of the population of each country and year through 2020. While no survey data was available beyond 2019, IHME used this model to estimate poverty rates for 2020 because it is more sensitive to economic shocks, like those currently being experienced in most countries. IHME forecasted extreme poverty rates ($1.90) for 2021 to 2030 by estimating the year-over-year change in the poverty rate using an ensemble model. This model is based on GDP per capita, fertility, government expenditure, and education forecasts; it only indirectly captures the other impacts of the global economic recession.
Updated estimates include new survey data for Nigeria, Pakistan, and Zimbabwe; improved PPP exchange rates; and better methods for estimating the consumption distribution.
Stunting
IHME measures stunting prevalence as height-for-age more than two standard deviations below the reference median on the height-age growth curve based on WHO 2006 growth standards for children 0–59 months. Projections to 2030 were modeled using an ensemble approach to predict stunting exposure, with SDI as a key driver, in order to capture the effects of the COVID-19 pandemic on income per capita; stunting exposure was then translated to the indicator (stunting prevalence) using a cascading spline model.
The results presented here represent several improvements incorporated into the Global Burden of Disease (GBD) 2020 study, leading to improved estimates in a number of countries, notably including South Africa, DRC, India, and Pakistan.
Murray, Christopher J.L., Alexandr Aravkin, Peng Zheng, Cristiana Abbafati, Kaja M. Abbas, Mohsen Abbasi-Kangevari, Foad Abd-Allah, et al. Global burden of 87 risk factors in 204 countries and territories, 1990–2019: A systematic analysis for the Global Burden of Disease Study 2019. Lancet 396, no. 10258: 1223–49 (October 17, 2020). https://doi.org/10.1016/S0140-6736(20)30752-2
Maternal Mortality Ratio
The maternal mortality ratio (MMR) is defined as the number of maternal deaths among women ages 15–49 years during a given time period per 100,000 live births during the same time period. MMR depicts the risk of maternal death relative to the number of live births and essentially captures the risk of death in a single pregnancy or a single live birth. Projections to 2030 used SDI as a key driver, which incorporates projections of income per capita and the effects of the COVID-19 pandemic.
IHME analysis of direct and indirect maternal mortality in selected countries showed no significant relationship between direct mortality and indicators of the COVID-19 pandemic (e.g., COVID-19 deaths, mobility). However, the COVID-19 pandemic had a significant effect on indirect maternal mortality, which IHME incorporated.
Under-5 Mortality Rate
IHME defines the under-5 mortality rate (U5MR) as the probability of death between birth and age 5. U5MR is expressed as number of deaths per 1,000 live births. Projections were based on a combination of key drivers, including Global Burden of Disease (GBD) risk factors, selected interventions (e.g., vaccines), and SDI. Additional short-term disruptions (2020–2021) from the COVID-19 pandemic incorporated the reductions seen in child deaths from infectious diseases (flu, respiratory syncytial virus, measles, pertussis) observed during the pandemic, driven primarily by social distancing and mask use. Most of the changes in U5MR estimates in the 2021 Goalkeepers Report results arise from new and additional input mortality data that IHME has incorporated since GBD2019. The addition of such new data primarily affects U5MR in the most recent time period.
Neonatal Mortality Rate
IHME defines the neonatal mortality rate as the probability of death in the first 28 completed days of life. It is expressed as the number of deaths per 1,000 live births. Projections were based on a combination of key drivers, including GBD risk factors, selected interventions (e.g., vaccines), and SDI. Short-term effects (2020-2021) incorporated the reductions seen in child deaths from infectious diseases (flu, respiratory syncytial virus, measles, pertussis) observed during the pandemic, driven primarily by social distancing and mask use. Most of the changes in neonatal mortality estimates in this year’s Goalkeepers Report are the result of new data.
HIV
IHME estimates the HIV rate as new HIV infections per 1,000 population. Forecasts of HIV incidence were based on forecasted antiretroviral therapy (ART), prevention of maternal-to-child transmission (PMTCT) coverage, and current infection incidence as inputs into a modified version of Avenir Health’s Spectrum software. Adult ART is forecasted using the expected spending on HIV curative care—which in turn was forecasted based on income per capita, including the effect of the COVID-19 pandemic—and ART prices.
Changes to estimates are the result of additional data compiled by UNAIDS from 115 countries, including new ART coverage, PMTCT coverage, and incidence estimates. Additionally, IHME updated ART coverage data for South Africa using Thembisa’s ART coverage estimates. Other modeling improvements are described in GBD 2020.
Tuberculosis
IHME estimates new and relapse tuberculosis cases diagnosed within a given calendar year (incidence) using data from prevalence surveys, case notifications, and cause-specific mortality estimates as inputs to a statistical model that enforces internal consistency among the estimates.
The changes in GBD 2020 TB incidence estimates were mainly driven by the inclusion of new data sources.
In addition to historical trends, projections to 2030 used SDI as a key driver, which incorporates projections of income per capita and the effects of the COVID-19 pandemic.
Malaria
IHME estimates the malaria rate as the number of new cases per 1,000 population. Projections to 2030 were derived using a two-stage model. First, coverage of the two key antimalarial interventions artemisinin-based combination therapy (ACT) and insecticide-treated bed nets (ITNs) were forecast as a function of SDI. IHME then used the residuals from the first stage to fit a country-specific model based on calendar year. For countries outside of sub-Saharan Africa, where there is no available data on intervention coverage, SDI was used in the first stage, and calendar year in the second stage. 2020 data on ITN distribution suggested minimal disruptions to ITN distribution due to the pandemic. Reports on ITN distribution were incorporated into the model, but no additional short-term effects of the pandemic were applied to malaria incidence.
Neglected Tropical Diseases
IHME measures the sum of the prevalence of 15 NTDs per 100,000 that are currently measured in the annual Global Burden of Disease study: human African trypanosomiasis, Chagas disease, cystic echinococcosis, cysticercosis, dengue, food-borne trematodiases, Guinea worm, soil-transmitted helminths (STH: comprising hookworm, trichuriasis, and ascariasis), leishmaniasis, leprosy, lymphatic filariasis, onchocerciasis, rabies, schistosomiasis, and trachoma. Since the 2020 Goalkeepers Report, changes in historical trends in this indicator reflect updates to the estimated prevalence of each NTD made for GBD 2020. Specifically, changes in the summary NTD prevalence indicator between the 2020 Goalkeepers Report and these estimates largely reflect the addition of new data to STH models, especially in Latin American and South Asia.
Modeling studies examining various disruption scenarios suggest that the impact of the COVID-19 pandemic on NTD prevalence and control is likely to vary broadly by disease and context. Given the limitations of available surveillance and control program data in 2020 and 2021—and uncertainty regarding the impact of any potential disruptions—IHME did not adjust for short-term effects of the COVID-19 pandemic in 2020–2021 for this report. As additional data becomes available, further work will be required to better understand whether and how the pandemic has affected NTD control programs and NTD prevalence. However, projections to 2030 did use SDI as a key driver, which incorporates projections of income per capita and the effects of the COVID-19 pandemic.
Hollingsworth, T. Déirdre, Pauline Mwinzi, Andreia Vasconcelos, and Sake J. de Vlas. “Evaluating the potential impact of interruptions to neglected tropical disease programmes due to COVID-19.” Transactions of the Royal Society of Tropical Medicine & Hygiene 115, no. 3 (Mar 6, 2021): 201–204. https://doi.org/10.1093/trstmh/trab023
Family Planning
IHME estimates the proportion of women of reproductive age (15–49 years) who have their need for family planning satisfied with modern contraceptive methods. Modern contraceptive methods include the current use of male or female sterilization, male or female condoms, diaphragms, cervical caps, sponges, spermicidal agents, oral hormonal pills, patches, rings, implants, injections, intrauterine devices (IUDs), and emergency contraceptives. Projections to 2030 used SDI as a key driver, which incorporates projections of income per capita and the effects of the COVID-19 pandemic.
IHME’s analysis of PMA surveys and the smartphone-based follow-up surveys referenced above in the section “Effect of the COVID-19 pandemic on health indicators in 2020–2022” does not show a consistent, significant reduction in contraception use due to the pandemic. As a result, IHME has not incorporated a short-term effect on the family planning indicator. Changes to the historical estimates can be attributed to the inclusion of 66 new data sources for GBD 2020. The new data sources were primarily post-2000 and located in sub-Saharan Africa, South-East Asia, East Asia, and Oceania.
Universal Health Coverage
The universal health coverage (UHC) effective coverage index is composed of 23 effective coverage indicators that cover population-age groups across the entire life course (maternal and newborn age groups, children under age 5, youths ages 5–19 years, adults ages 20–64, and adults ages 65 years old or older). These indicators fall within several health service domains: promotion, prevention, treatment, rehabilitation, and palliation.
Health system promotion indicators include met need for family planning with modern contraception.
Health system prevention indicators include the proportion of children receiving the third dose of the diphtheria-tetanus-pertussis vaccine and children receiving the first dose of measles-containing vaccine. Antenatal care for mothers and antenatal care for newborns are considered indicators of health system prevention and treatment of diseases affecting maternal and child health.
Indicators of treatment of communicable diseases are the mortality-to-incidence (MI) ratios for lower respiratory infections, diarrhea, and tuberculosis, as well as coverage of antiretroviral therapy among those with HIV/AIDS. Indicators of treatment of non-communicable diseases include MI ratios for acute lymphoid leukemia, appendicitis, paralytic ileus and intestinal obstruction, cervical cancer, breast cancer, uterine cancer, and colorectal cancer. Indicators of treatment of non-communicable diseases also include mortality-to-prevalence (MP) ratios for stroke, chronic kidney disease, epilepsy, asthma, chronic obstructive pulmonary disease, diabetes, and the risk-standardized death rate due to ischemic heart disease.
To produce forecasts of the UHC index from 2021 to 2030, a model for UHC was fit using total health spending per capita projections as the independent variable. Country- and year-specific inefficiencies were then extracted from the model and forecasted to 2030. These forecasted inefficiencies, along with forecasted total health spending per capita estimates, were substituted into the previously fit UHC model for all countries for 2021–2030.
Short-term effects due to the pandemic were included in the final 2021 Goalkeepers results with some exceptions. Maternal met demand for family planning was not adjusted, nor were antiretroviral therapy (ART) coverage scores, as described above in the relevant sections. Adjustments for vaccine delivery are described in the Vaccines subsection. For other indicators (19 out of 23), in the absence of data to inform the correspondence between reductions in utilization and reductions in coverage, IHME applied 25% of the reduction in monthly missed medical visits (excluding routine services).
Smoking
IHME measures the age-standardized prevalence of the daily use of smoked tobacco among people ages 15 and older. IHME collated information from all available surveys that include questions about daily use of tobacco, either currently or within the last 30 days, and information on the type of tobacco product smoked (including cigarettes, cigars, pipes, hookahs, as well as local products). IHME then converted all data to its standard definition so that meaningful comparisons could be made across locations and over time. Projections to 2030 used SDI as a key driver, which incorporates projections of income per capita and the effects of the COVID-19 pandemic.
Vaccines
IHME’s measurement of immunization coverage reports on the coverage of the following vaccines separately: three-dose diphtheria-tetanus-pertussis (DTP3), measles second dose (MCV2), and three-dose pneumococcal conjugate vaccine (PCV3). IHME measured the short-term (2020–2022) effects via administrative data on vaccine doses. In collaboration with WHO, IHME was able to synthesize data on the number of vaccine doses delivered by month in 2019 and 2020 from 94 countries. To estimate the change in vaccine coverage since the onset of the pandemic for each country, the number of doses delivered in each month of 2020 was compared to those delivered in the same month in 2019, adjusting for pre-pandemic year-to-year changes observed in January and February 2020. Administrative data was triangulated with qualitative information on the level of vaccine system disruption compiled by the WHO, including two recent WHO pulse polls, WHO Essential Health Services polls, and reports from WHO regional offices. Data sources that were implausible based on the reported level of disruption within a country were excluded. Projections to 2030 used SDI as a key driver, which incorporates projections of income per capita and the effects of the COVID-19 pandemic.
Evidence in the second half of 2020 suggested resumption of routine immunization services and/or catch-up vaccination in many countries and regions. At the time of the 2020 Goalkeepers Report, evidence suggested very large disruptions, which IHME projected through the rest of the year. Since that report, new data suggests that—in many locations—resumption of services and catch-up vaccination have been faster than originally predicted based on mobility alone. To better allow the model to account for this observation, a second step was added to the modeling framework initially developed for the 2020 Goalkeepers Report. This second step models changes in the residual variation in the relationship between vaccine delivery and mobility over time, allowing for catch-up vaccination and for resumption of vaccine delivery to occur at a different pace than suggested based on mobility trends alone. As a result of this new data and adjustments to the modeling framework, therefore, estimates of annual disruption in vaccine coverage in this report are smaller than in the 2020 Goalkeepers Report.
Causey, Kate, Nancy Fullman, Reed J. D. Sorensen, Natalie C. Galles, Peng Zheng, and Alexandr Aravkin. “Estimating global and regional disruptions to routine childhood vaccine coverage during the COVID-19 pandemic in 2020: a modelling study.” Lancet 398, no. 10299: P522–534 (August 7, 2021). https://doi.org/10.1016/S0140-6736(21)01337-4
Sanitation
IHME measured households with piped sanitation (with a sewer connection or septic tank); households with improved sanitation but without a sewer connection (pit latrine, ventilated improved latrine, pit latrine with slab, composting toilet); and households without improved sanitation (flush toilet that is not piped to sewer or septic tank, pit latrine without a slab or open pit, bucket, hanging toilet or hanging latrine, no facilities), as defined by the Joint Monitoring Programme for Water Supply and Sanitation. Projections to 2030 were modeled using an ensemble approach with SDI as a key driver in order to capture the effects of the COVID-19 pandemic and projections of income per capita. Past changes are primarily due to new data and changes in data processing.
World Health Organization (WHO) and the United Nations Children’s Fund (UNICEF). Progress on household drinking water, sanitation and hygiene 2000-2020: five years into the SDGs. Geneva: WHO and UNICEF, 2021. License: CC BY-NC-SA 3.0 IGO. https://washdata.org/sites/default/files/2021-07/jmp-2021-wash-households.pdf
Indicators Estimated from Other Sources
Agriculture
RuLIS - Rural Livelihoods Information System “Data by Indicator.” RuLIS (website), Food and Agriculture Organization of the United Nations (FAO). Most recent year available was used for select countries, ranging from 2005–2017. Accessed August 2020. www.fao.org/in-action/rural-livelihoods-dataset-rulis/data/by-indicator/en/
Food and Agriculture Organization of the United Nations (FAO). Use of AGRISurvey data for computing SDG’s and national indicators Experience in three countries. Country brief. Rome: FAO, 2021. License: CC BY-NC-SA 3.0 IGO. www.fao.org/3/cb4762en/cb4762en.pdf
For methodology, see:
Food and Agriculture Organization of the United Nations. Rural Livelihoods Information System (RuLIS): Technical Notes on Concepts and Definitions Used for the Indicators Derived from Household Surveys. Report. Rome: FAO, 2018. www.fao.org/3/ca2813en/CA2813EN.pdf
Education
UNESCO Institute for Statistics. “Sustainable Development Goal 4.” UIS (website). Data accessed August 2021. http://data.uis.unesco.org/
Data that was included last year for several (largely high-income) countries was moved out of this grade 2/3 data set because the TIMSS and PIRLS assessments on which the data is based were judged to be better aligned to the end-of-primary assessment point.
Gender Equality
The chart is based on data from the United Nations Global SDG Database and the World Bank’s World Development Indicators database.
The data is the most recent available for 90 countries and territories (2001–2019). The age group is 15 or older where available (18 or older in Ghana). In a number of cases, data is for those ages 10 or older or 12 or older. In the case of Thailand (2015), they are for those ages 6 or older, and in the United Republic of Tanzania (2014) for those ages 5 or older. Data for Bulgaria, Denmark, Latvia, the Netherlands, Slovenia, and Spain corresponds to time spent on unpaid care among those ages 20 to 74 only. Differences across countries should be interpreted with caution, given heterogeneity across surveys and countries in definitions, methodology, and sample coverage. Time-diary data often excludes supervisory responsibilities, leading to underestimation of the time constraints of care.
The regional average ratios are the averages of the ratios of the component countries, and the global average ratio is the average of the ratios of all countries included. The global average ratio is different from that reported in the SDGs section of the United Nations Statistical Division report because the latter used the ratio of the average amount of time spent by women on unpaid work to the average amount of time spent by men.
For further information on the country-level data, see:
UN Statistics Division. “SDG Indicators: United Nations Global SDG Database.” UNSD (website). Updated July 2021. https://unstats.un.org/sdgs/indicators/database/
The World Bank. “World Development Indicators: World Bank Database.” Updated July 2021. https://databank.worldbank.org/source/world-development-indicators
Financial Services for the Poor
Demirgüç, Asli, Leora Klapper, Dorothe Singer, Saniya Ansar, and Jake Hess. The Global Findex Database 2017: Measuring Financial Inclusion and the Fintech Revolution. Washington, DC: World Bank, 2018. https://globalfindex.worldbank.org/
The “Richest/Poorest” comparison refers to what the World Bank calculates as account ownership of the richest 60% of households and poorest 40% of households, respectively.
Apedo-Amah, Marie Christine, Besart Avdiu, Xavier Cirera, Marcio Cruz, Elwyn Davies, Arti Grover, Leonardo Iacovone, Umut Kilinc, Denis Medvedev, Franklin Okechukwu Maduko, Stavros Poupakis, Jesica Torres, Trang Thu Tran. Unmasking the Impact of COVID-19 on Businesses: Firm Level Evidence from Across the World. Policy Research Working Paper; No. 9434. Washington, DC: World Bank, 2020. License: Creative Commons Attribution CC BY 3.0 IGO. http://hdl.handle.net/10986/34626
Gentilini, Ugo, et al. Social Protection and Jobs Responses to COVID-19 : A Real-Time Review of Country Measures. “Living Paper version 15. Washington, DC: World Bank, May 14, 2021. License: Creative Commons Attribution CC BY 3.0 IGO. http://hdl.handle.net/10986/33635